Over the last couple of weeks, we have been working on revamping our documentation and enhancing the overall experience of Ironforge.
Additionally, today we are releasing the first of many updates where we are focusing on improving transaction observability.
Features or Improvements
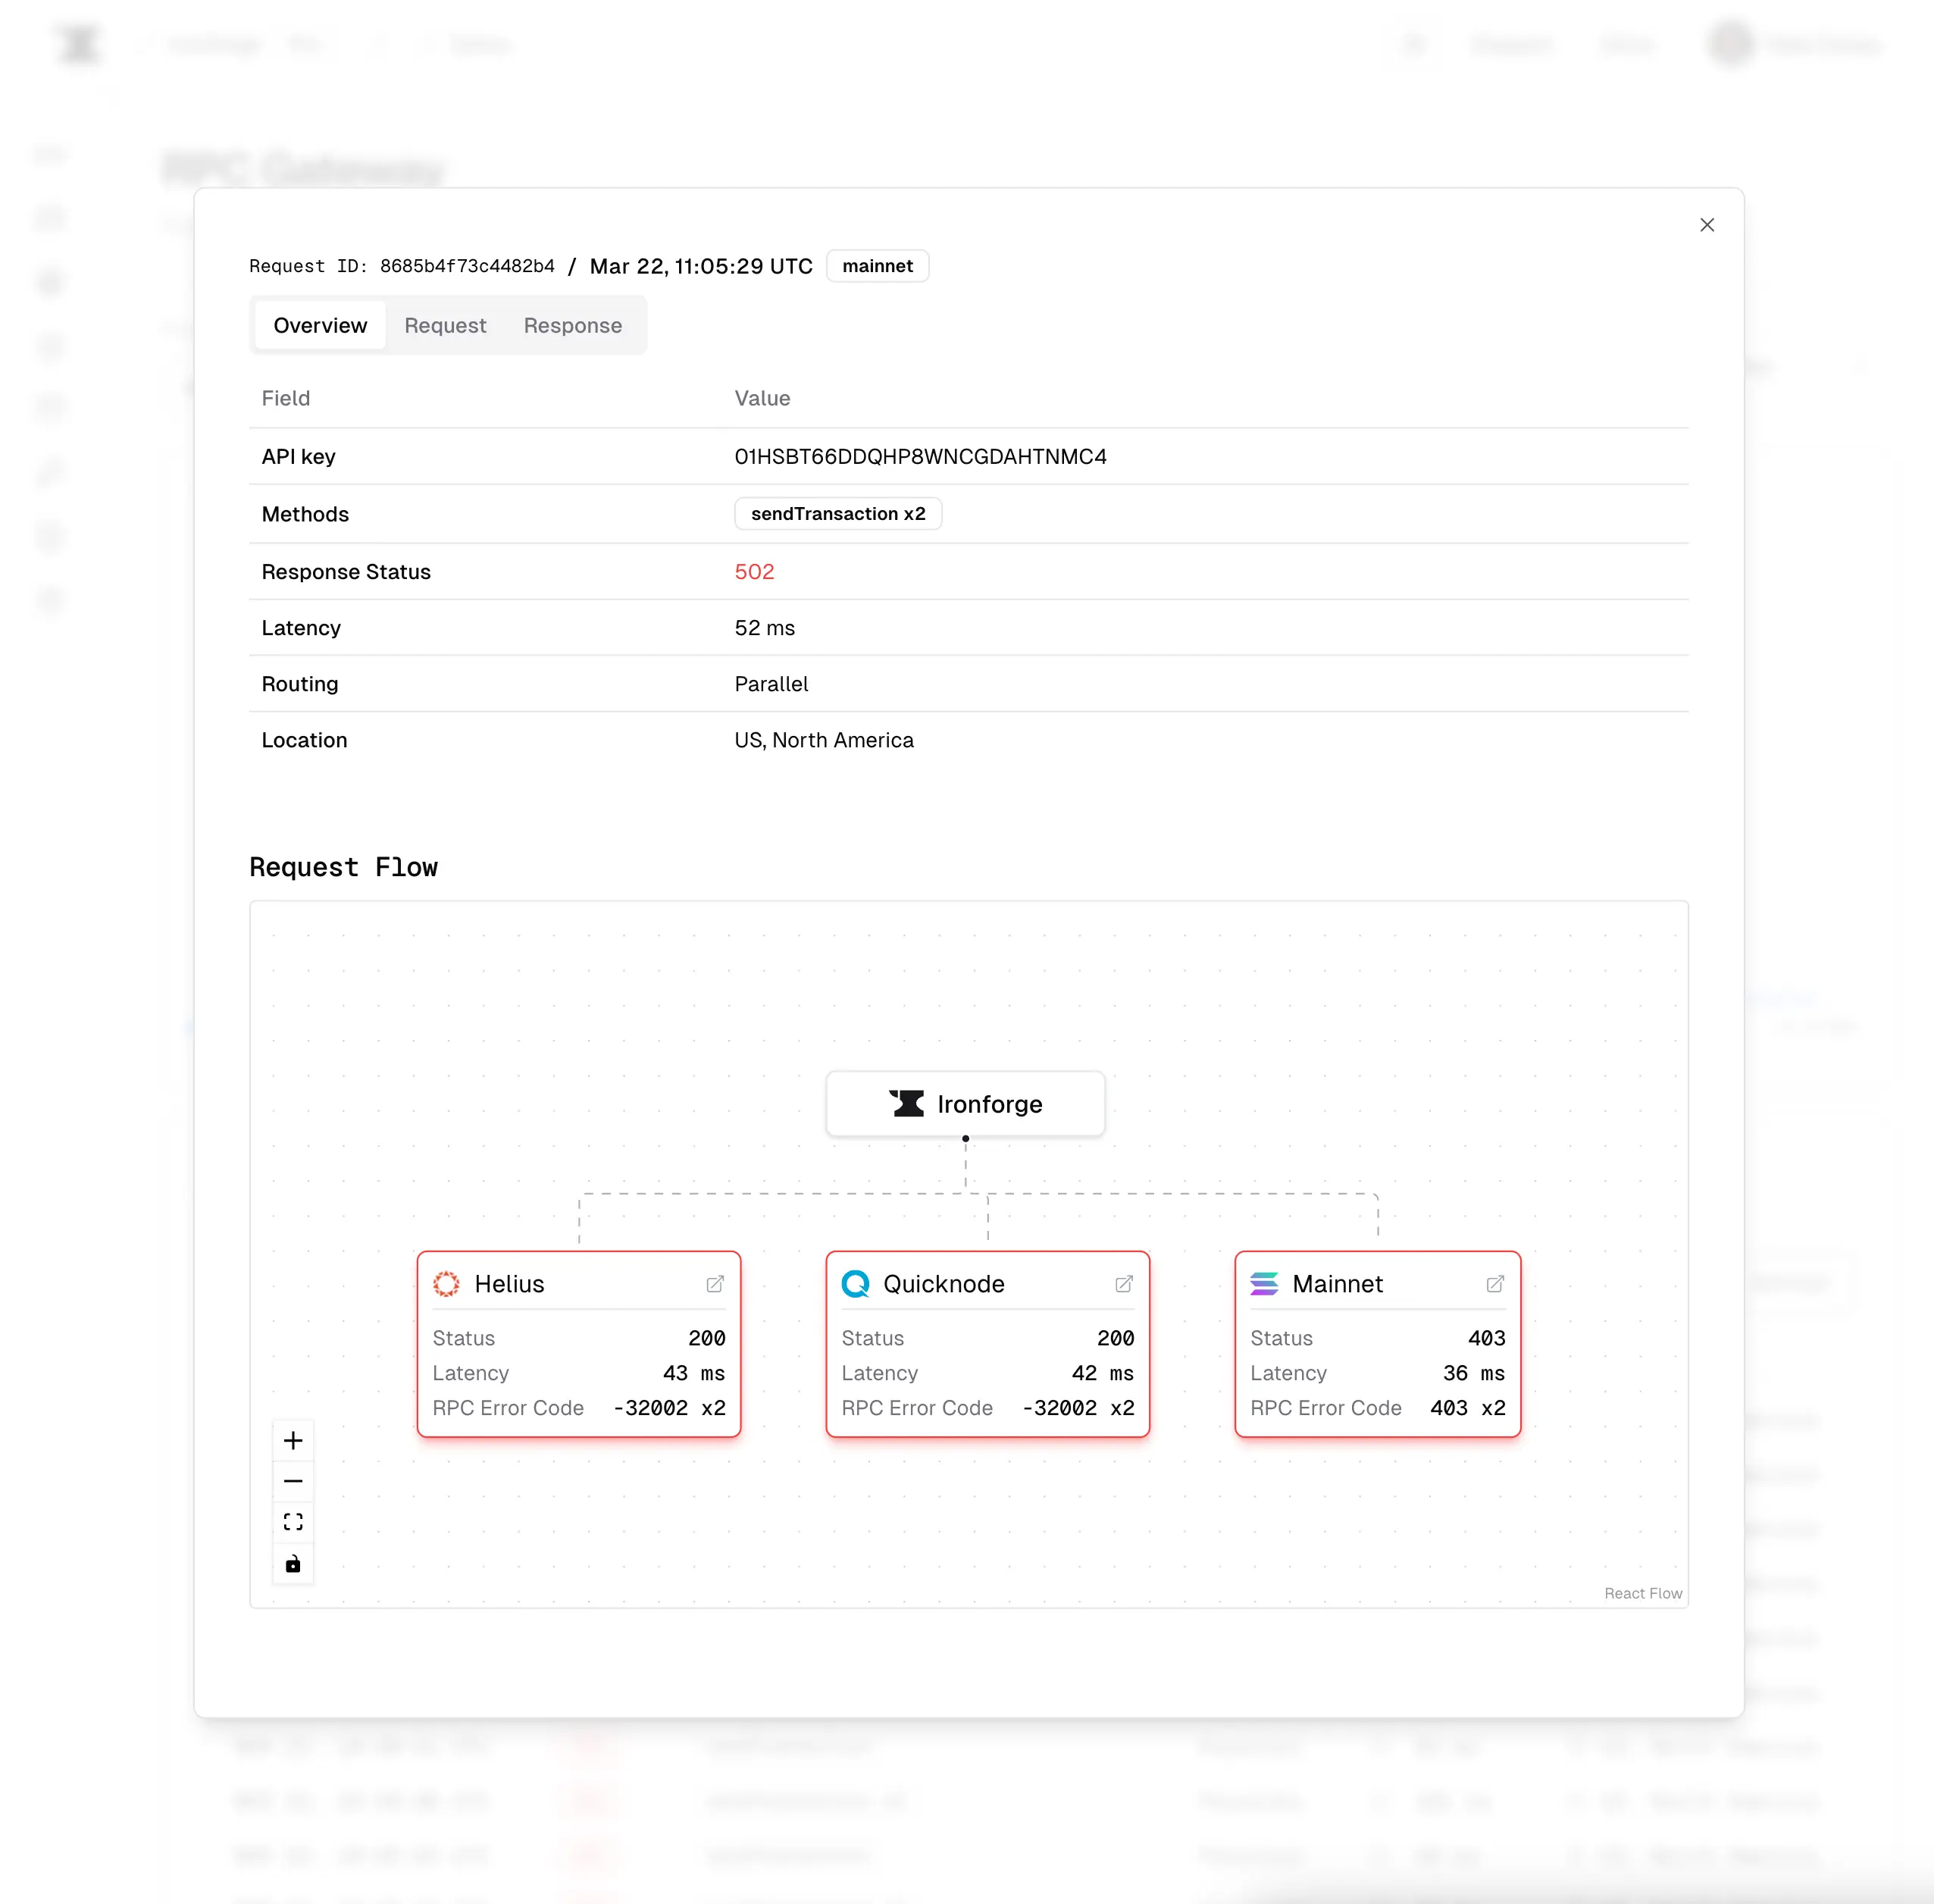
New Logs Details
We have enhanced the log details to provide more information. Additionally, we have redesigned the layout to improve navigation, making it easier and more intuitive.

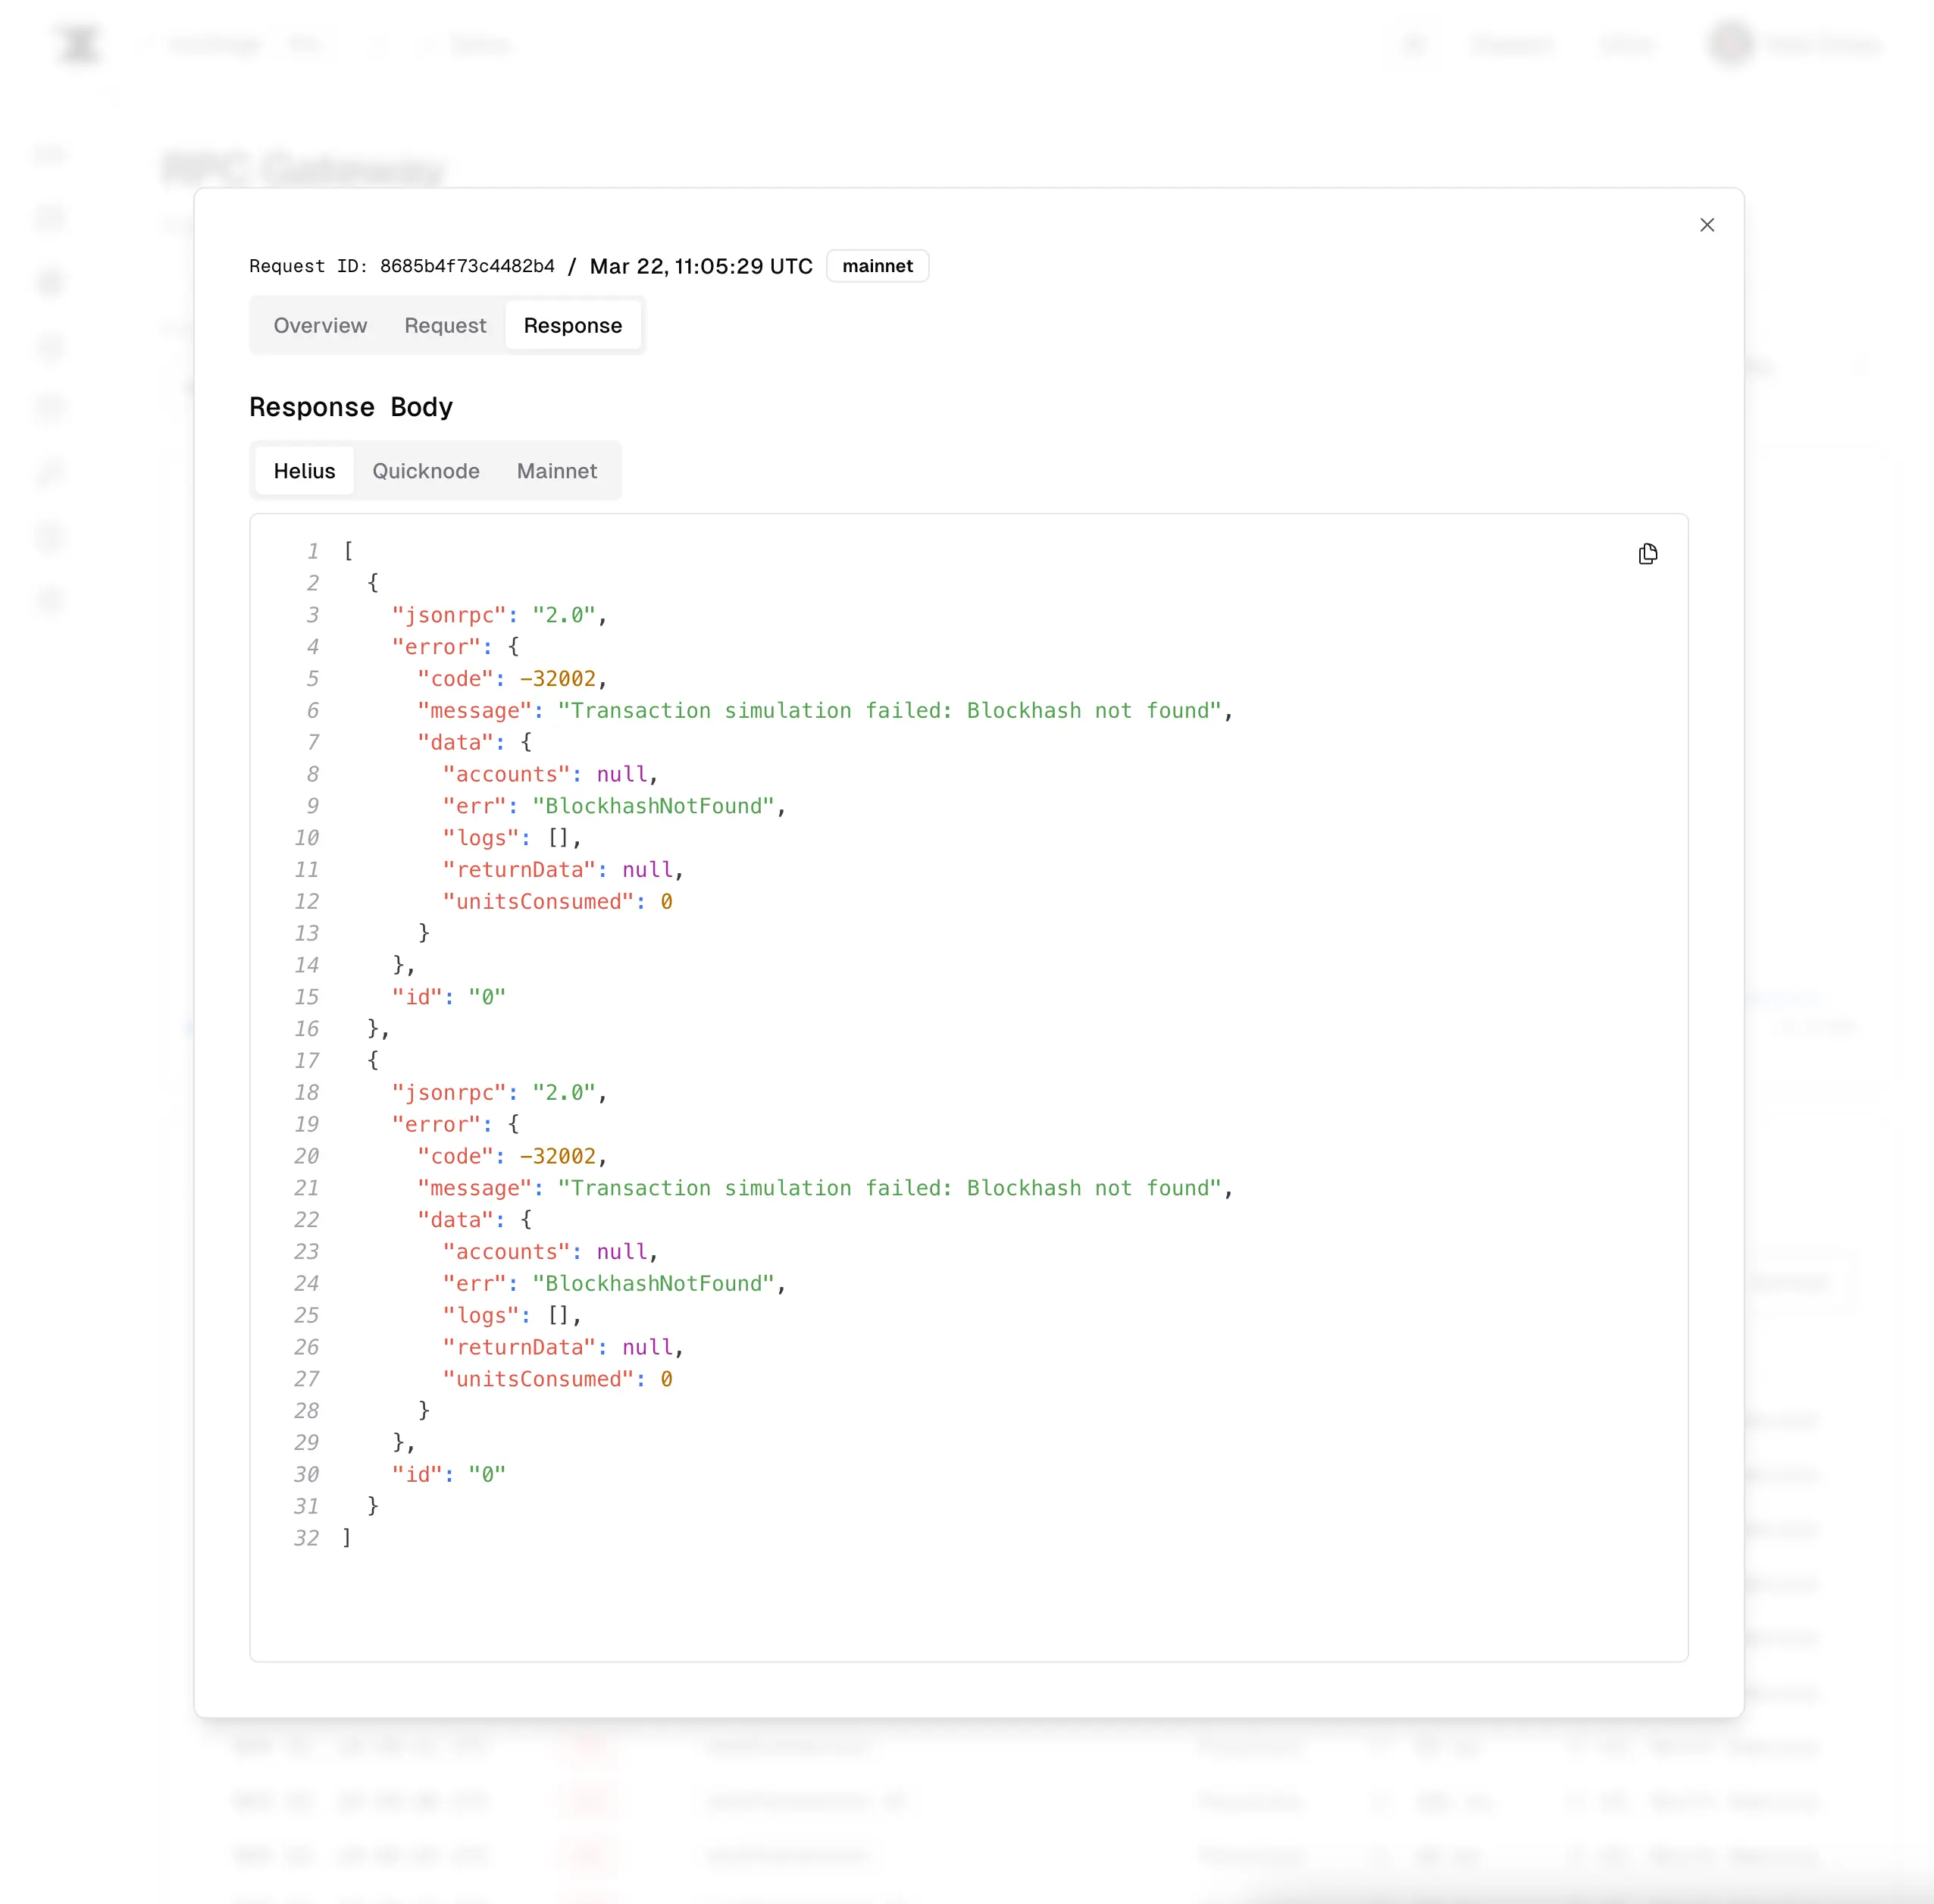
Improved Transaction Observability
Being able to observe your transactions and understand how they are performing is crucial for any Solana applications these days. Starting now, we can show more details for transactions that are failing pre-flight check errors or similar issues.

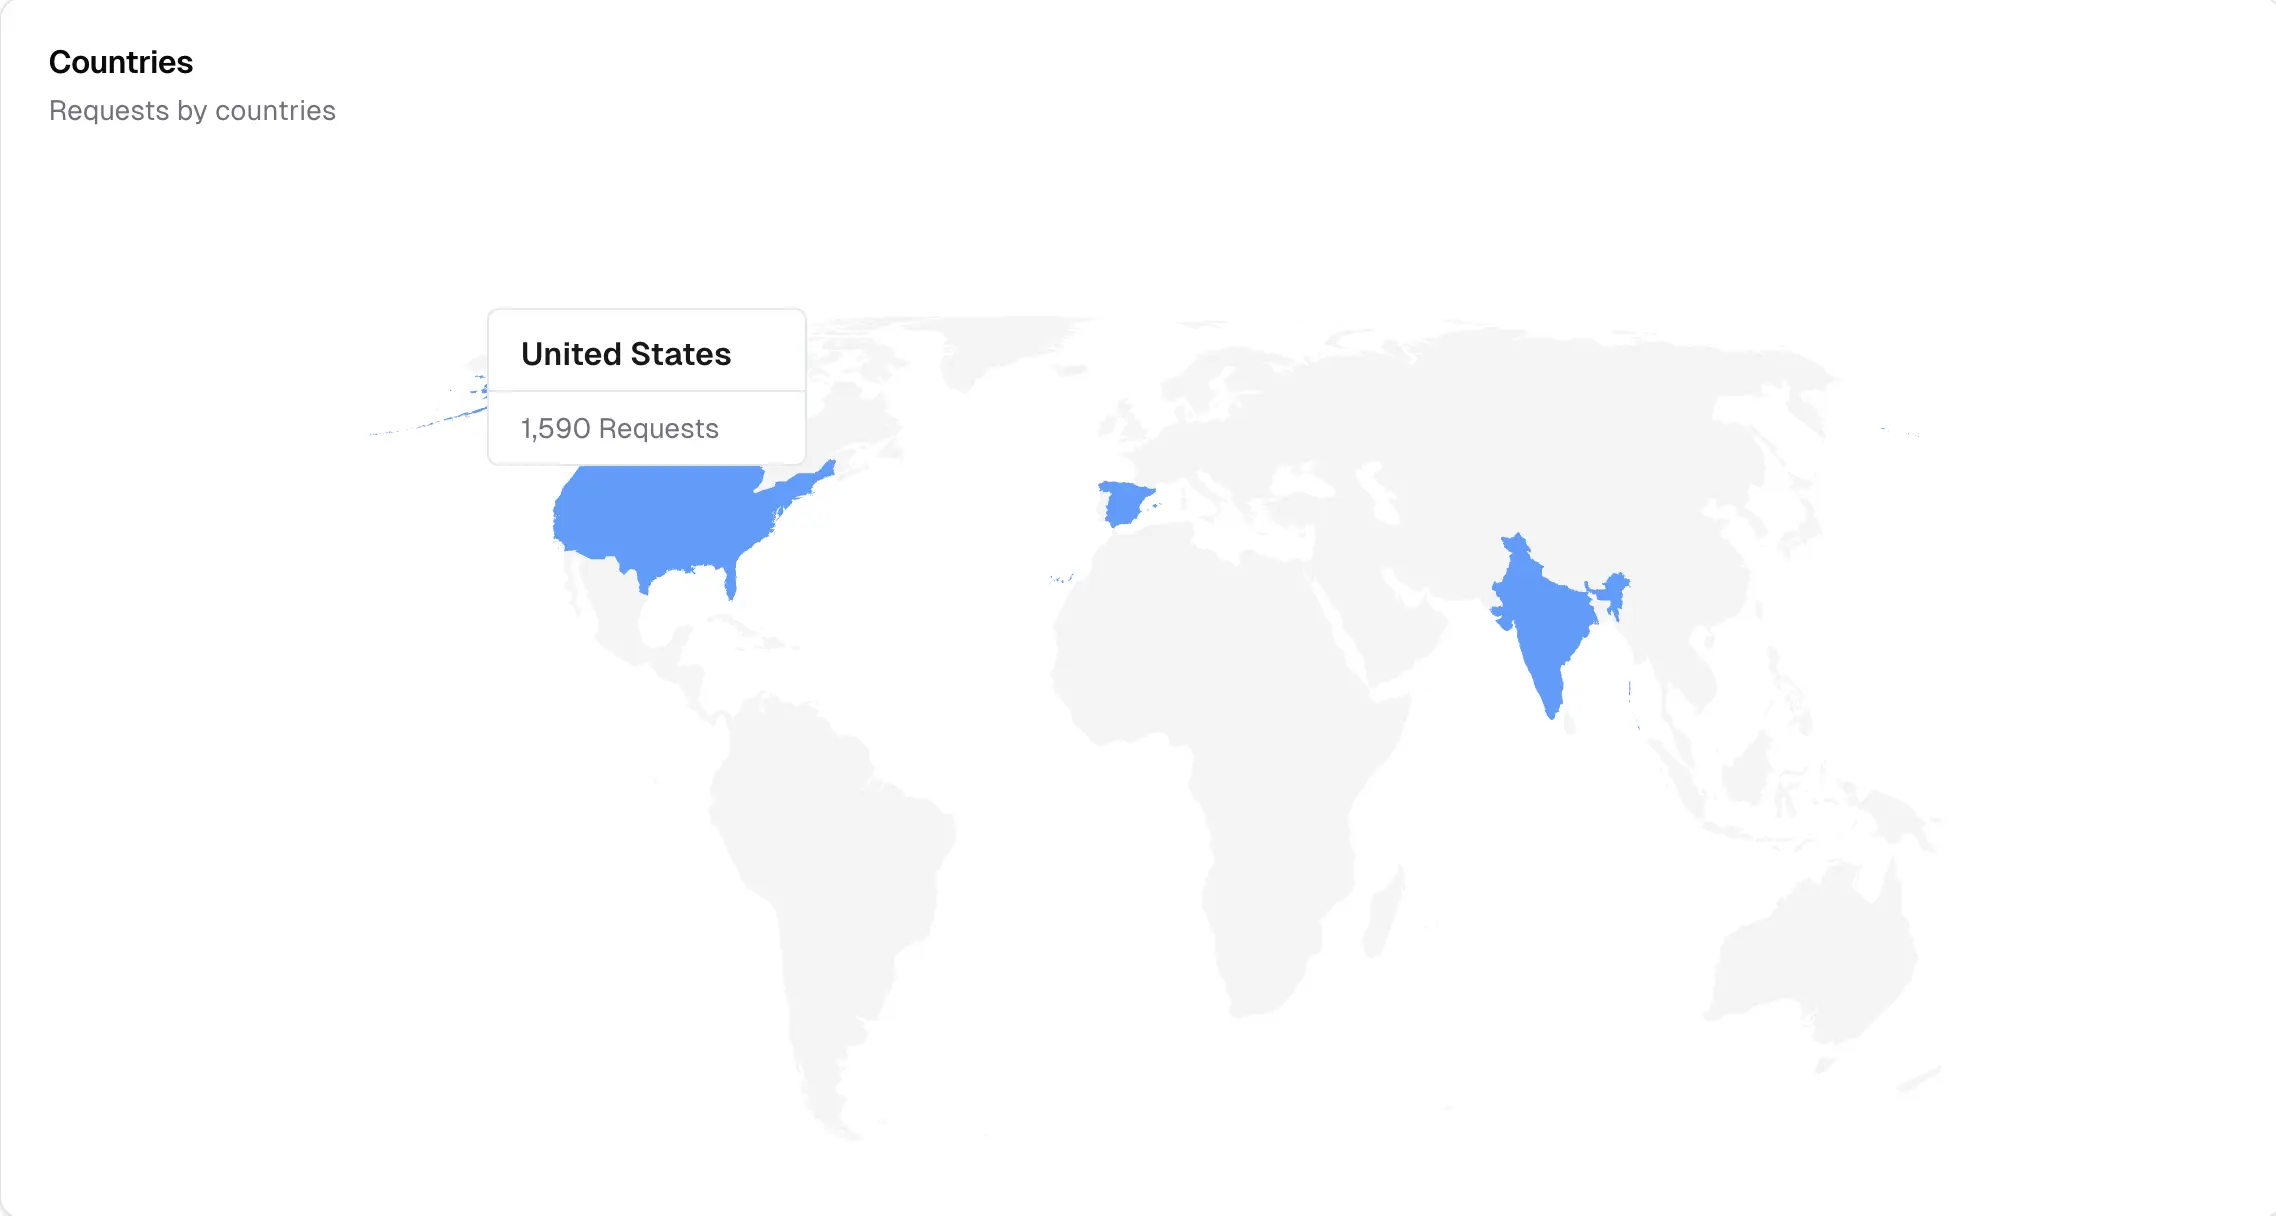
Improved Requests Geographical Distribution Representation
We have enhanced the geographical distribution representation of the requests. This will help you understand where your requests are coming from.
To access this, go to "Analytics" and scroll down to the bottom of the page.

UX Improvements
We have made several UX improvements across the platform. We are continuing to improve our dark mode and loading states to make the experience more enjoyable.
Content
We have been working on improving our documentation and adding more guides to help you get started with Ironforge.
New Guides
- How do I blacklist RPC methods?
- How to view my RPC requests latency
- How to filter my logs by RPC methods
What's next?
For April, we are working on a more dynamic routing configuration, and we will continue to release more updates regarding transaction observability.
If you wish to stay updated on our progress, you can follow us on Twitter at https://twitter.com/IronforgeCloud.